Profiling and optimizing Go web applications
Go has a powerful built-in profiler that supports CPU, memory, goroutine and block (contention) profiling.
Enabling the profiler #
Go provides a low-level profiling API runtime/pprof, but if you are developing a long-running service, it's more convenient to work with a high-level net/http/pprof package.
All you need to enable the profiler is to import net/http/pprof and it will automatically register the required HTTP handlers:
package main

import (
    "net/http"
    _ "net/http/pprof"
)

func hiHandler(w http.ResponseWriter, r *http.Request) {
    w.Write([]byte("hi"))
}

func main() {
    http.HandleFunc("/", hiHandler)
    http.ListenAndServe(":8080", nil)
}
If your web application is using a custom URL router, you'll need to register a few pprof HTTP endpoints manually:
package main

import (
    "net/http"
    "net/http/pprof"
)

func hiHandler(w http.ResponseWriter, r *http.Request) {
    w.Write([]byte("hi"))
}

func main() {
    r := http.NewServeMux()
    r.HandleFunc("/", hiHandler)

    // Register pprof handlers
    r.HandleFunc("/debug/pprof/", pprof.Index)
    r.HandleFunc("/debug/pprof/cmdline", pprof.Cmdline)
    r.HandleFunc("/debug/pprof/profile", pprof.Profile)
    r.HandleFunc("/debug/pprof/symbol", pprof.Symbol)
    r.HandleFunc("/debug/pprof/trace", pprof.Trace)

    http.ListenAndServe(":8080", r)
}
That's it, launch the application, and then use the pprof tool:
go tool pprof [binary] http://127.0.0.1:8080/debug/pprof/profileOne of the biggest pprof advantages is that it has low overhead and can be used in a production environment on a live traffic without any noticeable performance penalties.
But before digging deeper into pprof, we need a real example which can show how to identify and fix performance issues in Go.
Example: Left-pad microservice #
Assume you need to develop a brand-new microservice that adds a left padding to a given input string:
$ curl "http://127.0.0.1:8080/v1/leftpad/?str=test&len=10&chr=*"
{"str":"******test"}
The service needs to collect some basic metrics - the number of incoming requests and how long every request takes. All collected metrics are supposed to be sent to a metric aggregator (e.g. StatsD). In addition, the service needs to log the request details - URL, IP address and user-agent.
You can find the initial implementation on GitHub tagged as v1.
Compile and run the application:
go build && ./goprofexMeasuring the performance #
We are going to measure how many requests per second the microservice is able to handle. This can be done using the Apache Benchmark tool:
ab -k -c 8 -n 100000 "http://127.0.0.1:8080/v1/leftpad/?str=test&len=50&chr=*"
# -k   Enables HTTP keep-alive
# -c   Number of concurrent requests
# -n   Number of total requests to make
Not bad, but could be faster:
Requests per second:    22810.15 [#/sec] (mean)
Time per request: 0.042 [ms] (mean, across all concurrent requests)CPU profile #
Run the Apache benchmark tool again, but with a high number of requests (1 million should be enough) and at the same time run pprof:
go tool pprof http://127.0.0.1:8080/debug/pprof/profileThe CPU profiler runs for 30 seconds by default. It uses sampling to determine which functions spend most of the CPU time. The Go runtime stops the execution every 10 milliseconds and records the current call stack of all running goroutines.
When pprof enters the interactive mode, type top, the command will show a list of functions that appeared most in the collected samples. In our case these are all runtime and standard library functions, which is not very useful:
(pprof) top
63.77s of 69.02s total (92.39%)
Dropped 331 nodes (cum <= 0.35s)
Showing top 10 nodes out of 78 (cum >= 0.64s)
      flat  flat%   sum%        cum   cum%
    50.79s 73.59% 73.59%     50.92s 73.78%  syscall.Syscall
     4.66s  6.75% 80.34%      4.66s  6.75%  runtime.kevent
     2.65s  3.84% 84.18%      2.65s  3.84%  runtime.usleep
     1.88s  2.72% 86.90%      1.88s  2.72%  runtime.freedefer
     1.31s  1.90% 88.80%      1.31s  1.90%  runtime.mach_semaphore_signal
     1.10s  1.59% 90.39%      1.10s  1.59%  runtime.mach_semaphore_wait
     0.51s  0.74% 91.13%      0.61s  0.88%  log.(*Logger).formatHeader
     0.49s  0.71% 91.84%      1.06s  1.54%  runtime.mallocgc
     0.21s   0.3% 92.15%      0.56s  0.81%  runtime.concatstrings
     0.17s  0.25% 92.39%      0.64s  0.93%  fmt.(*pp).doPrintf
There is a much better way to look at the high-level performance overview - -http flag:
go tool pprof -http=:8081 http://127.0.0.1:8080/debug/pprof/profileWhen you run pprof with the -http flag, the tool opens the profile in the web browser. The graph allows to see all hot spots:
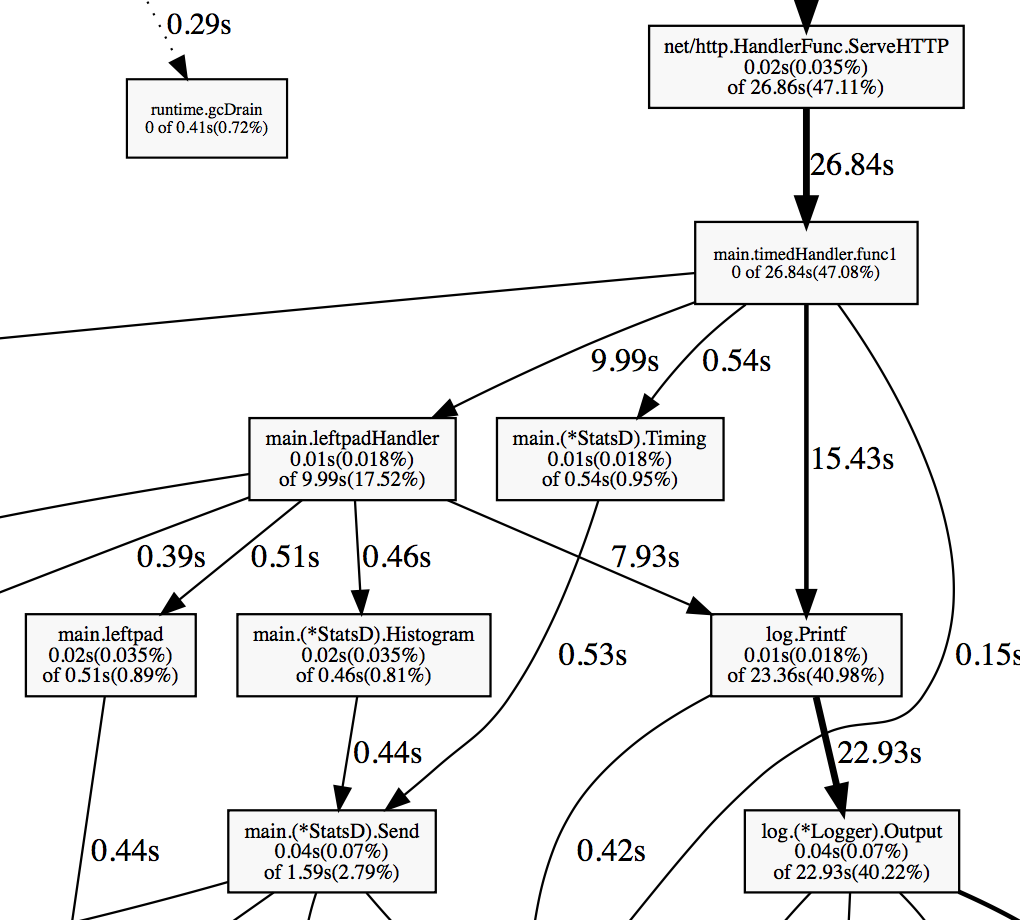
From the graph above you can see that the application spends a big chunk of CPU on logging, metric reporting and some time on garbage collection.
Use list to inspect every function in details, e.g. list leftpad:
(pprof) list leftpad
ROUTINE ======================== main.leftpad in /Users/artem/go/src/github.com/akrylysov/goprofex/leftpad.go
      20ms      490ms (flat, cum)  0.71% of Total
         .          .      3:func leftpad(s string, length int, char rune) string {
         .          .      4:   for len(s) < length {
      20ms      490ms      5:       s = string(char) + s
         .          .      6:   }
         .          .      7:   return s
         .          .      8:}
For those who are not afraid to look at the disassembled code, pprof includes disasm command, which helps to see the actual processor instructions:
(pprof) disasm leftpad
ROUTINE ======================== main.leftpad
      20ms      490ms (flat, cum)  0.71% of Total
         .          .    1312ab0: GS MOVQ GS:0x8a0, CX
         .          .    1312ab9: CMPQ 0x10(CX), SP
         .          .    1312abd: JBE 0x1312b5e
         .          .    1312ac3: SUBQ $0x48, SP
         .          .    1312ac7: MOVQ BP, 0x40(SP)
         .          .    1312acc: LEAQ 0x40(SP), BP
         .          .    1312ad1: MOVQ 0x50(SP), AX
         .          .    1312ad6: MOVQ 0x58(SP), CX
...
Heap profile #
Run the heap profiler:
go tool pprof http://127.0.0.1:8080/debug/pprof/heapBy default it shows the amount of memory currently in-use:
(pprof) top
512.17kB of 512.17kB total (  100%)
Dropped 85 nodes (cum <= 2.56kB)
Showing top 10 nodes out of 13 (cum >= 512.17kB)
      flat  flat%   sum%        cum   cum%
  512.17kB   100%   100%   512.17kB   100%  runtime.mapassign
         0     0%   100%   512.17kB   100%  main.leftpadHandler
         0     0%   100%   512.17kB   100%  main.timedHandler.func1
         0     0%   100%   512.17kB   100%  net/http.(*Request).FormValue
         0     0%   100%   512.17kB   100%  net/http.(*Request).ParseForm
         0     0%   100%   512.17kB   100%  net/http.(*Request).ParseMultipartForm
         0     0%   100%   512.17kB   100%  net/http.(*ServeMux).ServeHTTP
         0     0%   100%   512.17kB   100%  net/http.(*conn).serve
         0     0%   100%   512.17kB   100%  net/http.HandlerFunc.ServeHTTP
         0     0%   100%   512.17kB   100%  net/http.serverHandler.ServeHTTP
But we are more interested in the number of allocated objects. Call pprof with -alloc_objects option:
go tool pprof -alloc_objects http://127.0.0.1:8080/debug/pprof/heapAlmost 70% of all objects was allocated only by two functions - leftpad and StatsD.Send, we'll need to look at them closer:
(pprof) top
559346486 of 633887751 total (88.24%)
Dropped 32 nodes (cum <= 3169438)
Showing top 10 nodes out of 46 (cum >= 14866706)
      flat  flat%   sum%        cum   cum%
 218124937 34.41% 34.41%  218124937 34.41%  main.leftpad
 116692715 18.41% 52.82%  218702222 34.50%  main.(*StatsD).Send
  52326692  8.25% 61.07%   57278218  9.04%  fmt.Sprintf
  39437390  6.22% 67.30%   39437390  6.22%  strconv.FormatFloat
  30689052  4.84% 72.14%   30689052  4.84%  strings.NewReplacer
  29869965  4.71% 76.85%   29968270  4.73%  net/textproto.(*Reader).ReadMIMEHeader
  20441700  3.22% 80.07%   20441700  3.22%  net/url.parseQuery
  19071266  3.01% 83.08%  374683692 59.11%  main.leftpadHandler
  17826063  2.81% 85.90%  558753994 88.15%  main.timedHandler.func1
  14866706  2.35% 88.24%   14866706  2.35%  net/http.Header.clone
Other useful options to debug memory issues are -inuse_objects - displays the count of objects in-use and -alloc_space - shows how much memory has been allocated since the program start.
Automatic memory management is convenient, but nothing is free in the world. Dynamic allocations are not only significantly slower than stack allocations but also affect the performance indirectly. Every piece of memory you allocate on the heap adds more work to the GC and makes it use more CPU resources. The only way to make the application spend less time on garbage collection is to reduce allocations.
Escape analysis #
Whenever you use the & operator to get a pointer to a variable or allocate a new value using make or new it doesn't necessary mean that it's allocated on the heap.
func foo(a []string) {
      fmt.Println(len(a))
}

func main() {
      foo(make([]string, 8))
}
In the example above make([]string, 8) is allocated on stack. Go uses escape analysis to determine if it's safe to allocate memory on stack instead of the heap. You can add -gcflags=-m option to see the results of escape analysis:
5  type X struct {v int}
6
7  func foo(x *X) {
8       fmt.Println(x.v)
9  }
10
11 func main() {
12      x := &X{1}
13      foo(x)
14 }
go build -gcflags=-m
./main.go:7: foo x does not escape
./main.go:12: main &X literal does not escapeGo compiler is smart enough to turn some dynamic allocations into stack allocations. Things get worse for example when you start dealing with interfaces:
// Example 1
type Fooer interface {
      foo(a []string)
}

type FooerX struct{}

func (FooerX) foo(a []string) {
      fmt.Println(len(a))
}

func main() {
      a := make([]string, 8) // make([]string, 8) escapes to heap
      var fooer Fooer
      fooer = FooerX{}
      fooer.foo(a)
}

// Example 2
func foo(a interface{}) string {
      return a.(fmt.Stringer).String()
}

func main() {
      foo(make([]string, 8)) // make([]string, 8) escapes to heap
}
Go Escape Analysis Flaws paper by Dmitry Vyukov describes more cases that escape analysis is unable to handle.
Generally speaking, you should prefer values over pointers for small structures that you don't need to change.
Goroutine profile #
Goroutine profile dumps the goroutine call stack and the number of running goroutines:
go tool pprof http://127.0.0.1:8080/debug/pprof/goroutine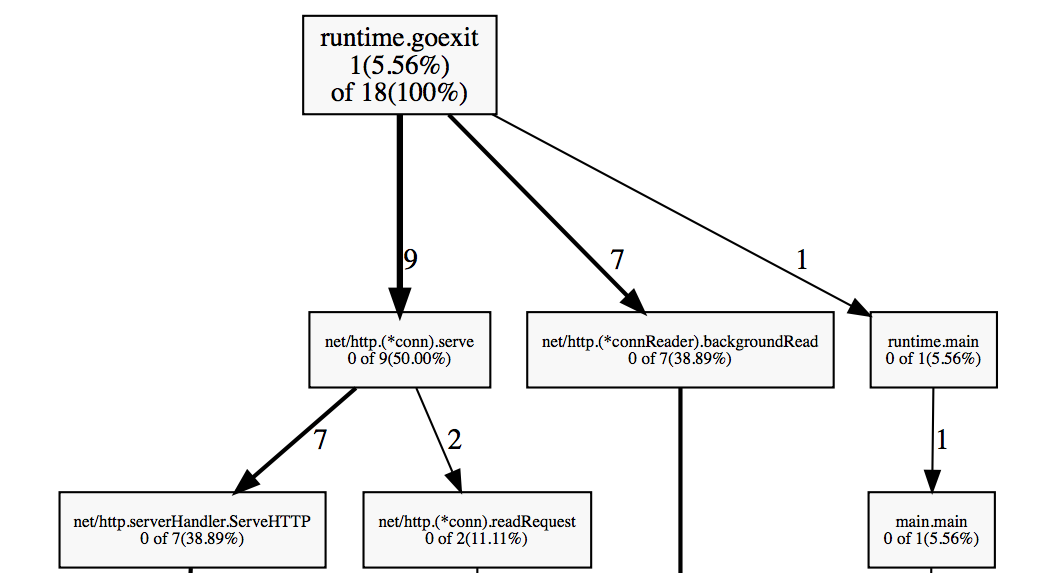
There are only 18 active goroutines, which is very low. It's not uncommon to have thousands of running goroutines without significant performance degradation.
Block profile #
Blocking profile shows function calls that led to blocking on synchronization primitives like mutexes and channels.
Before running the block contention profile, you have to set a profiling rate using runtime.SetBlockProfileRate. You can add the call to your main or init function.
go tool pprof http://127.0.0.1:8080/debug/pprof/block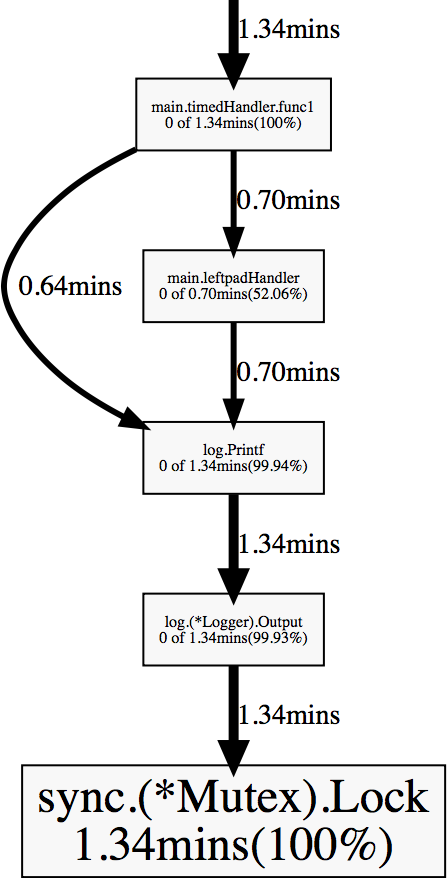
timedHandler and leftpadHandler spend a lot of time waiting on a mutex inside log.Printf. It happens because log package implementation uses a mutex to synchronize access to a file shared across multiple goroutines.
Benchmarking #
As we noticed before, the biggest offenders in terms of performance are log package, leftpad and StatsD.Send functions. Now we found the bottleneck, but before starting to optimize the code, we need a reproducible way to measure the performance of the code we are interested in. The Go testing package includes such a mechanism. You need to create a function in the form of func BenchmarkXxx(*testing.B) in a test file:
func BenchmarkStatsD(b *testing.B) {
    statsd := StatsD{
        Namespace:  "namespace",
        SampleRate: 0.5,
    }
    for i := 0; i < b.N; i++ {
        statsd.Incr("test")
    }
}
It's also possible to benchmark the whole HTTP handler using net/http/httptest package:
func BenchmarkLeftpadHandler(b *testing.B) {
    r := httptest.NewRequest("GET", "/v1/leftpad/?str=test&len=50&chr=*", nil)
    for i := 0; i < b.N; i++ {
        w := httptest.NewRecorder()
        leftpadHandler(w, r)
    }
}
Run the benchmarks:
go test -bench=. -benchmemIt shows the amount of time each iteration takes and the amount of memory/number of allocations:
BenchmarkTimedHandler-4           200000          6511 ns/op        1621 B/op         41 allocs/op
BenchmarkLeftpadHandler-4         200000         10546 ns/op        3297 B/op         75 allocs/op
BenchmarkLeftpad10-4             5000000           339 ns/op          64 B/op          6 allocs/op
BenchmarkLeftpad50-4              500000          3079 ns/op        1568 B/op         46 allocs/op
BenchmarkStatsD-4                1000000          1516 ns/op         560 B/op         15 allocs/op
Improving the performance #
Logging #
A good but not always obvious way to make the application faster is to make it do less work. Other than for debug purposes the line log.Printf("%s request took %v", name, elapsed) doesn't need to be in the web service. All unnecessary logs should be removed or disabled from the code before deploying it to production. This problem can be solved using a leveled logger - there are plenty of logging libraries.
Another important thing about logging (and about all I/O operations in general) is to use buffered input/output when possible which can help reduce the number of system calls. Usually, there is no need to write to a file on every logger call - use bufio package to implement buffered I/O. We can simply wrap the io.Writer object that we pass to a logger with bufio.NewWriter or bufio.NewWriterSize:
log.SetOutput(bufio.NewWriterSize(f, 1024*16))leftpad #
Take a look at the leftpad function again:
func leftpad(s string, length int, char rune) string {
    for len(s) < length {
        s = string(char) + s
    }
    return s
}
Concatenating strings in a loop is not the smartest thing to do - every loop iteration allocates a new string. A better way to build a string is to use bytes.Buffer:
func leftpad(s string, length int, char rune) string {
    buf := bytes.Buffer{}
    for i := 0; i < length-len(s); i++ {
        buf.WriteRune(char)
    }
    buf.WriteString(s)
    return buf.String()
}
Alternatively, we can use string.Repeat which makes the code slightly shorter:
func leftpad(s string, length int, char rune) string {
    if len(s) < length {
        return strings.Repeat(string(char), length-len(s)) + s
    }
    return s
}
StatsD client #
The next piece of code we need to change is StatsD.Send function:
func (s *StatsD) Send(stat string, kind string, delta float64) {
    buf := fmt.Sprintf("%s.", s.Namespace)
    trimmedStat := strings.NewReplacer(":", "_", "|", "_", "@", "_").Replace(stat)
    buf += fmt.Sprintf("%s:%s|%s", trimmedStat, delta, kind)
    if s.SampleRate != 0 && s.SampleRate < 1 {
        buf += fmt.Sprintf("|@%s", strconv.FormatFloat(s.SampleRate, 'f', -1, 64))
    }
    ioutil.Discard.Write([]byte(buf)) // TODO: Write to a socket
}
Here are some possible improvements:
Sprintf is convenient for string formatting, and it's perfectly fine unless you start calling it thousands of times per second. It spends CPU time to parse the input format string, and it allocates a new string on every call. We can replace it with bytes.Buffer + Buffer.WriteString/Buffer.WriteByte.
The function doesn't need to create a new Replacer instance every time, it can be declared as a global variable or as a part of StatsD structure.
Replace strconv.FormatFloat with strconv.AppendFloat and pass it a buffer allocated on stack to prevent additional heap allocations.
func (s *StatsD) Send(stat string, kind string, delta float64) {
    buf := bytes.Buffer{}
    buf.WriteString(s.Namespace)
    buf.WriteByte('.')
    buf.WriteString(reservedReplacer.Replace(stat))
    buf.WriteByte(':')
    buf.Write(strconv.AppendFloat(make([]byte, 0, 24), delta, 'f', -1, 64))
    buf.WriteByte('|')
    buf.WriteString(kind)
    if s.SampleRate != 0 && s.SampleRate < 1 {
        buf.WriteString("|@")
        buf.Write(strconv.AppendFloat(make([]byte, 0, 24), s.SampleRate, 'f', -1, 64))
    }
    buf.WriteTo(ioutil.Discard) // TODO: Write to a socket
}
That reduces the number of allocations from 14 to 1 and makes Send run about 4x faster:
BenchmarkStatsD-4 5000000 381 ns/op 112 B/op 1 allocs/opMeasuring the result #
The benchmarks show a very nice performance boost after all optimizations:
benchmark                     old ns/op     new ns/op     delta
BenchmarkTimedHandler-4       6511          1181          -81.86%
BenchmarkLeftpadHandler-4     10546         3337          -68.36%
BenchmarkLeftpad10-4          339           136           -59.88%
BenchmarkLeftpad50-4          3079          201           -93.47%
BenchmarkStatsD-4             1516          381           -74.87%

benchmark                     old allocs     new allocs     delta
BenchmarkTimedHandler-4       41             5              -87.80%
BenchmarkLeftpadHandler-4     75             18             -76.00%
BenchmarkLeftpad10-4          6              3              -50.00%
BenchmarkLeftpad50-4          46             3              -93.48%
BenchmarkStatsD-4             15             1              -93.33%

benchmark                     old bytes     new bytes     delta
BenchmarkTimedHandler-4       1621          448           -72.36%
BenchmarkLeftpadHandler-4     3297          1416          -57.05%
BenchmarkLeftpad10-4          64            24            -62.50%
BenchmarkLeftpad50-4          1568          160           -89.80%
BenchmarkStatsD-4 560 112 -80.00%Run ab again:
Requests per second:    32619.54 [#/sec] (mean)
Time per request:       0.030 [ms] (mean, across all concurrent requests)
The web service can handle about 10000 additional requests per second now!
Optimization tips #
Avoid unnecessary heap allocations.
Prefer values over pointers for not big structures.
Preallocate maps and slices if you know the size beforehand.
Don't log if you don't have to.
Use buffered I/O if you do many sequential reads or writes.
If your application extensively uses JSON, consider utilizing parser/serializer generators (I personally prefer easyjson).
Every operation matters in a hot path.
Conclusion #
Sometimes the bottleneck may be not what you are expecting - profiling is the best and sometimes the only way to understand the real performance of your application.
You can find the full source code on GitHub. The initial version is tagged as v1 and the optimized version is tagged as v2. Here is the link to compare these two versions.